

Console
The Console opens on an overview of your organization: what Endgame knows, what your team has added to it, who is using Endgame, what your team is working on, what connected agents are doing, and which automations are running. Click on a card to open its full view.- Context graph — facts on record, the entities and relationships behind them, and how much the graph has grown recently
- Context added — what your team has contributed back to the graph
- People — users split between active and dormant
- Themes — the kinds of work your team uses Endgame for, with the top theme over the past 30 days
- Agent sessions — sessions run by your team and by any automations running alongside them
- Automations — API keys and applications running against Endgame
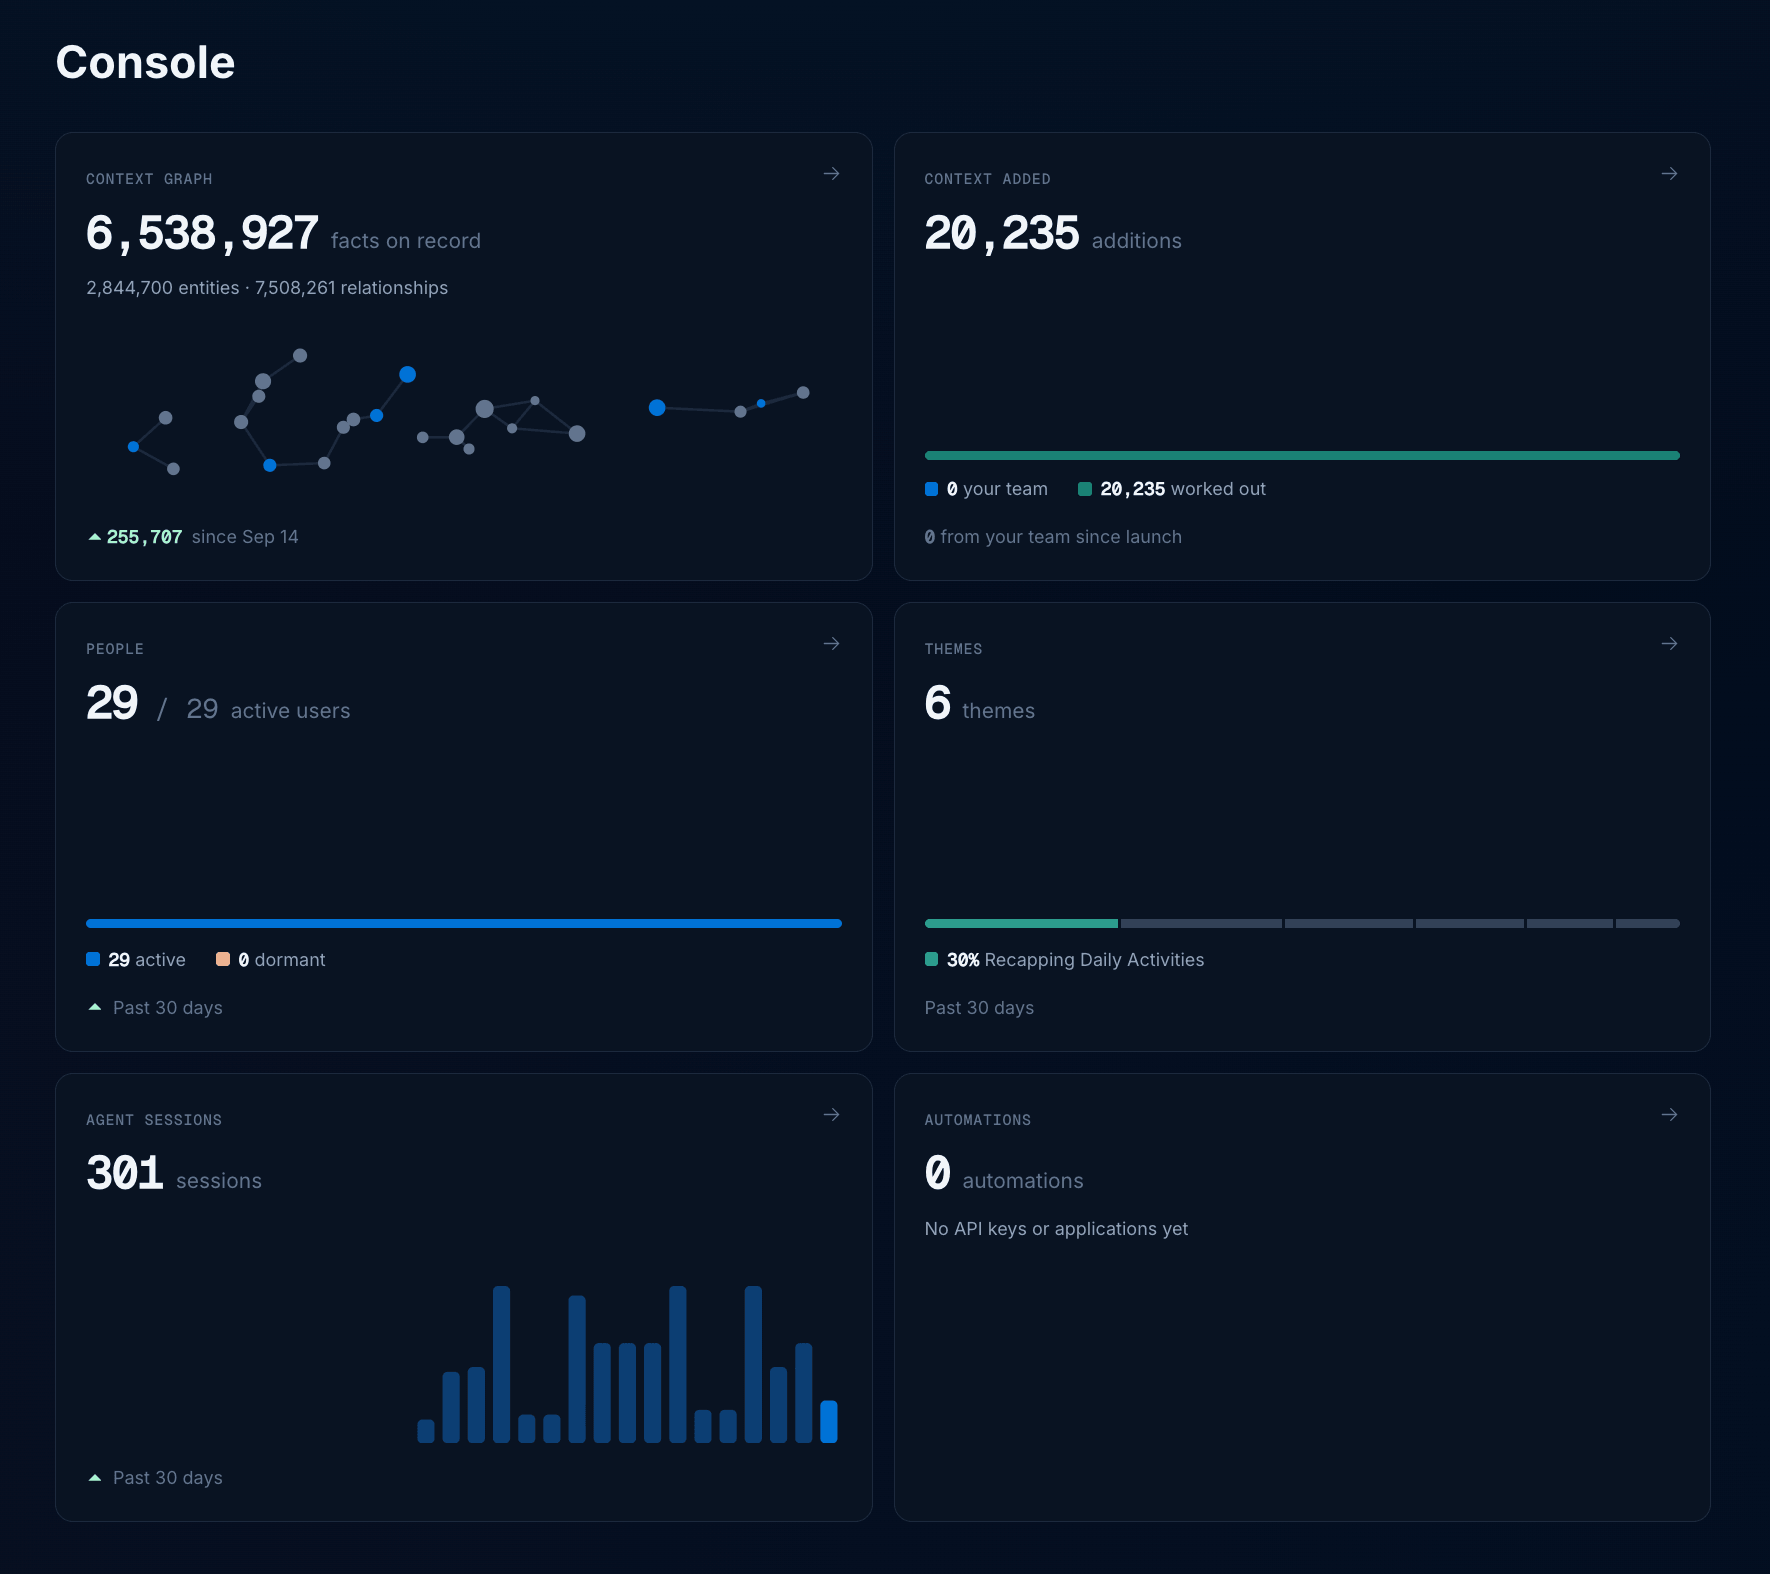
Console overview
People
The People view shows who is actually using Endgame. The totals at the top show how many people were active in the last 30 days, split by how many days they showed up: Daily active (15+ days), Weekly active (4–14 days), and Occasionally active (1–3 days). Inactive counts people who have not used Endgame in 30+ days, or have never been active. Active users by month tracks how your team’s adoption has grown, with each month broken down into daily, weekly, and occasional users. Below the chart, people are listed by how often they show up, along with a trend of their recent activity and the number of days they were active. Use the search bar to find anyone by name.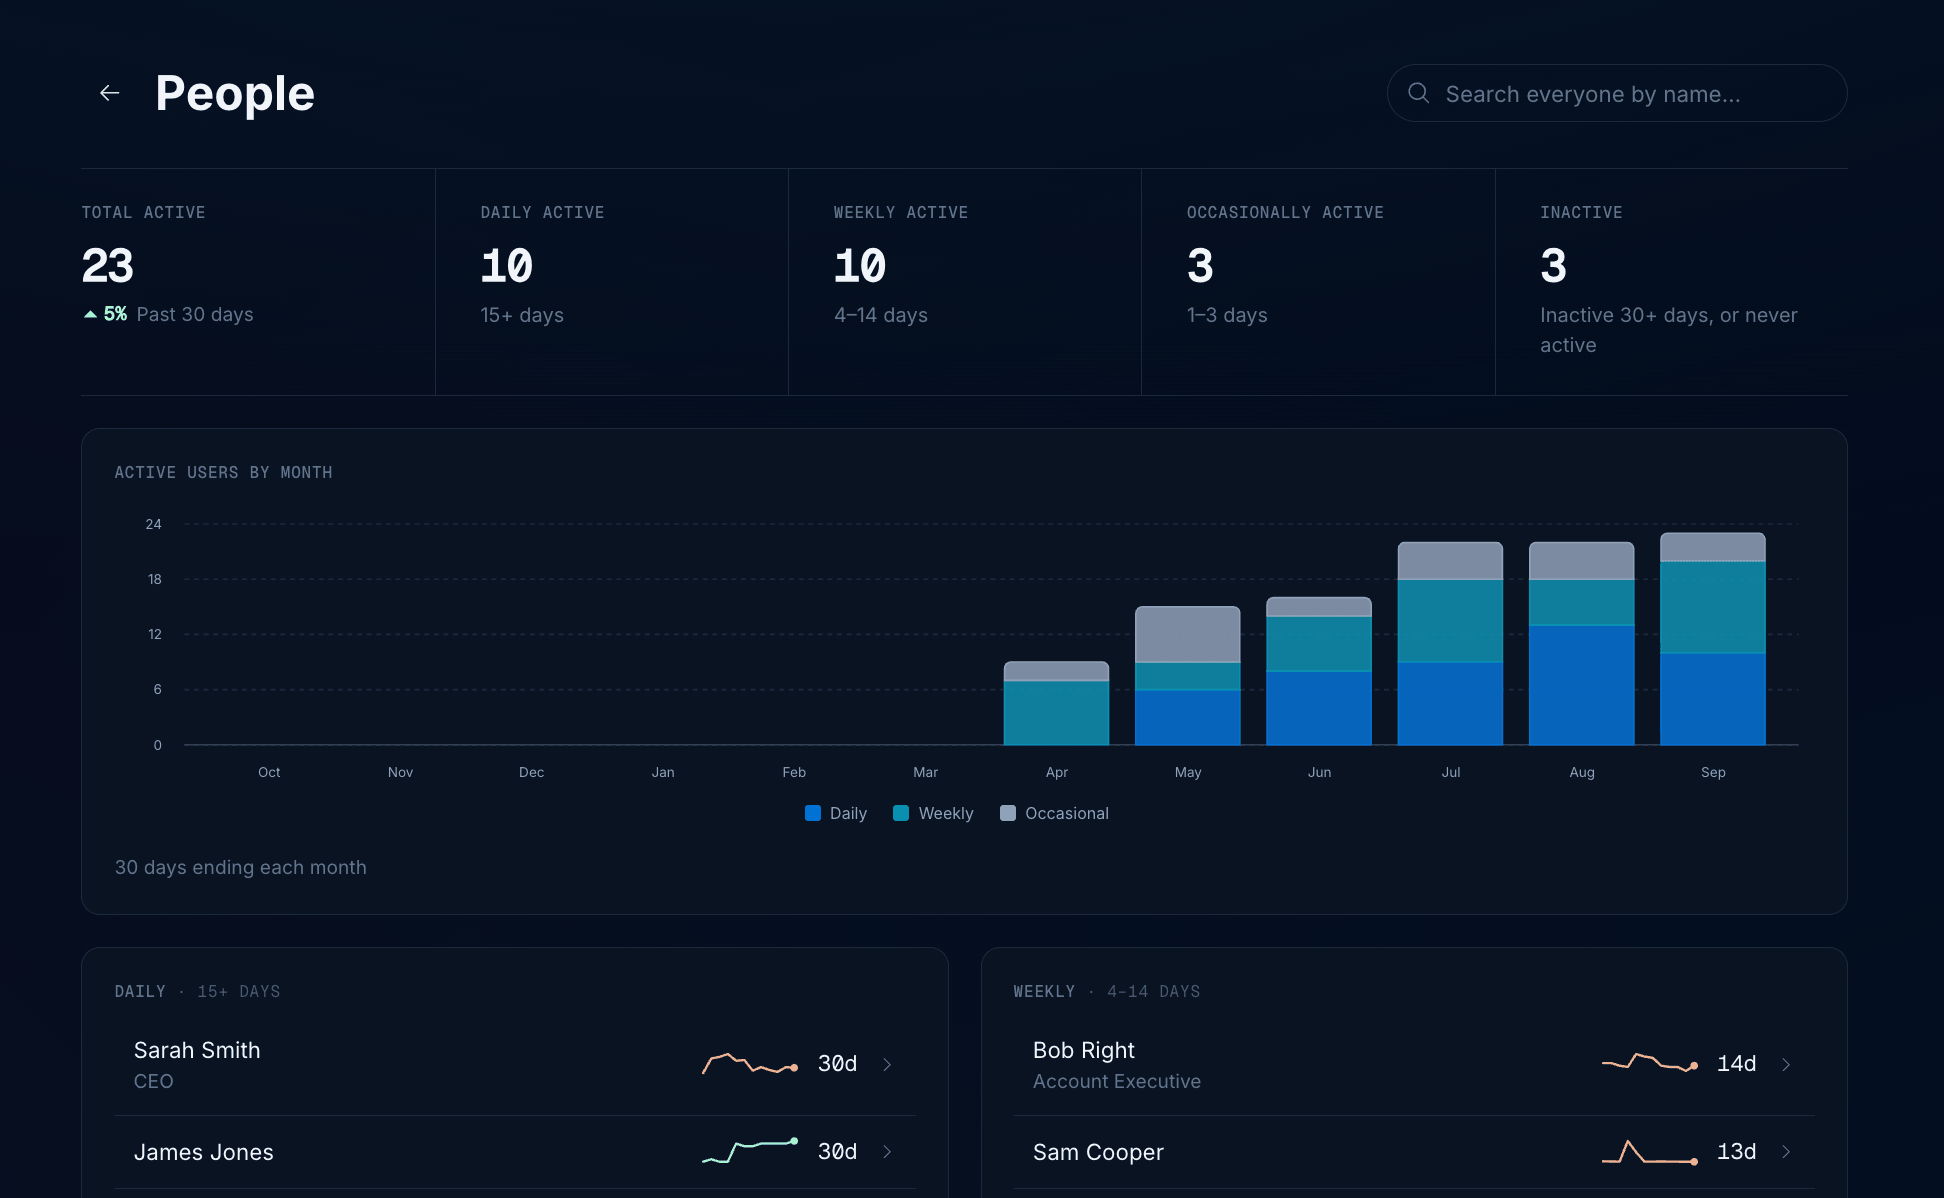
People view in the Console

Person detail view in the Console
Themes
The Themes view shows what your team is using Endgame for over the last 7, 30, or 90 days. Endgame clusters a sample of the tool calls your team’s agents sent into themes, such as preparing for customer meetings, researching accounts before outreach, or building stakeholder maps. Each theme shows its share of agent work along with an anonymized example of a request that falls under it.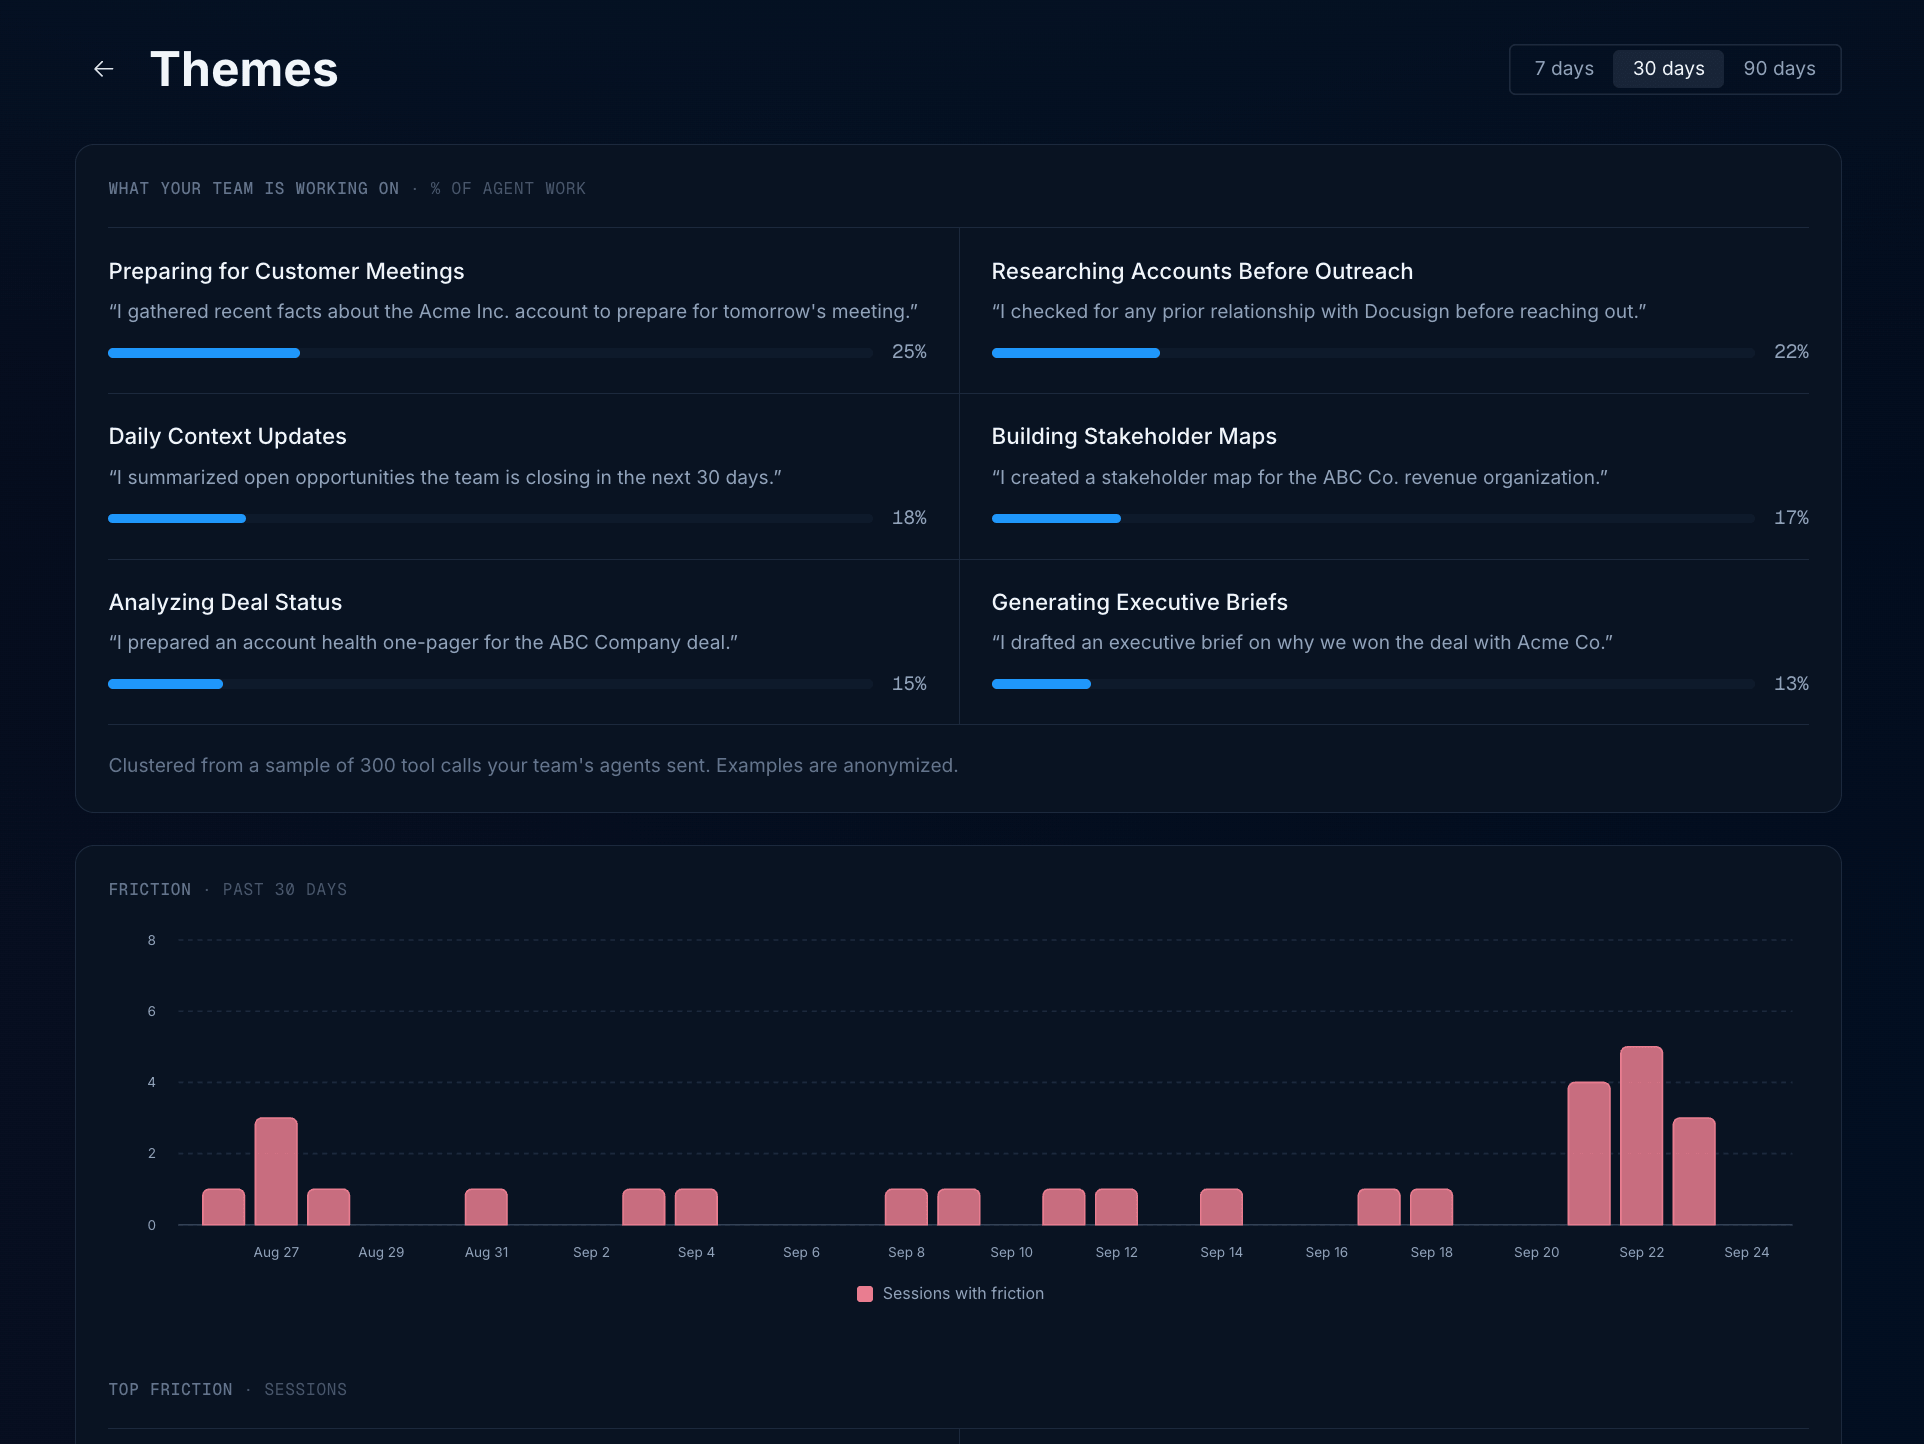
Themes view in the Console
Context added
The Context added view tracks what your team has written back to the context graph. Endgame learns from these contributions and directly makes updates to the graph, so this view is a read on how closely your team is engaging with what Endgame tells them.- Corrections — a field was wrong or missing
- Relationships — a link between people or companies, added or disputed
- New facts — something true that fits no field anywhere
- New entities — a person or company Endgame did not know at all

Context added view in the Console
Agent sessions
The Agent sessions view summarizes how your team and its connected agents are using Endgame over the last 7, 30, or 90 days:- Active users — how many people used Endgame during the selected window
- Agent sessions — how many sessions connected agents ran
- Tool calls — how many individual tool calls those sessions made

Agent sessions view in the Console
Automations
The Automations view shows the API keys and applications running against Endgame on your organization’s behalf, over the last 7, 30, or 90 days. The Activity chart breaks sessions down by automation for each day, so you can see which automations are running and how often. The Automations table lists each automation with its sessions over the last 30 days, its kind (such as API key), the person who owns it, when it was created, and when it was last active. Use it to find automations that are no longer running, or to see who to contact about one.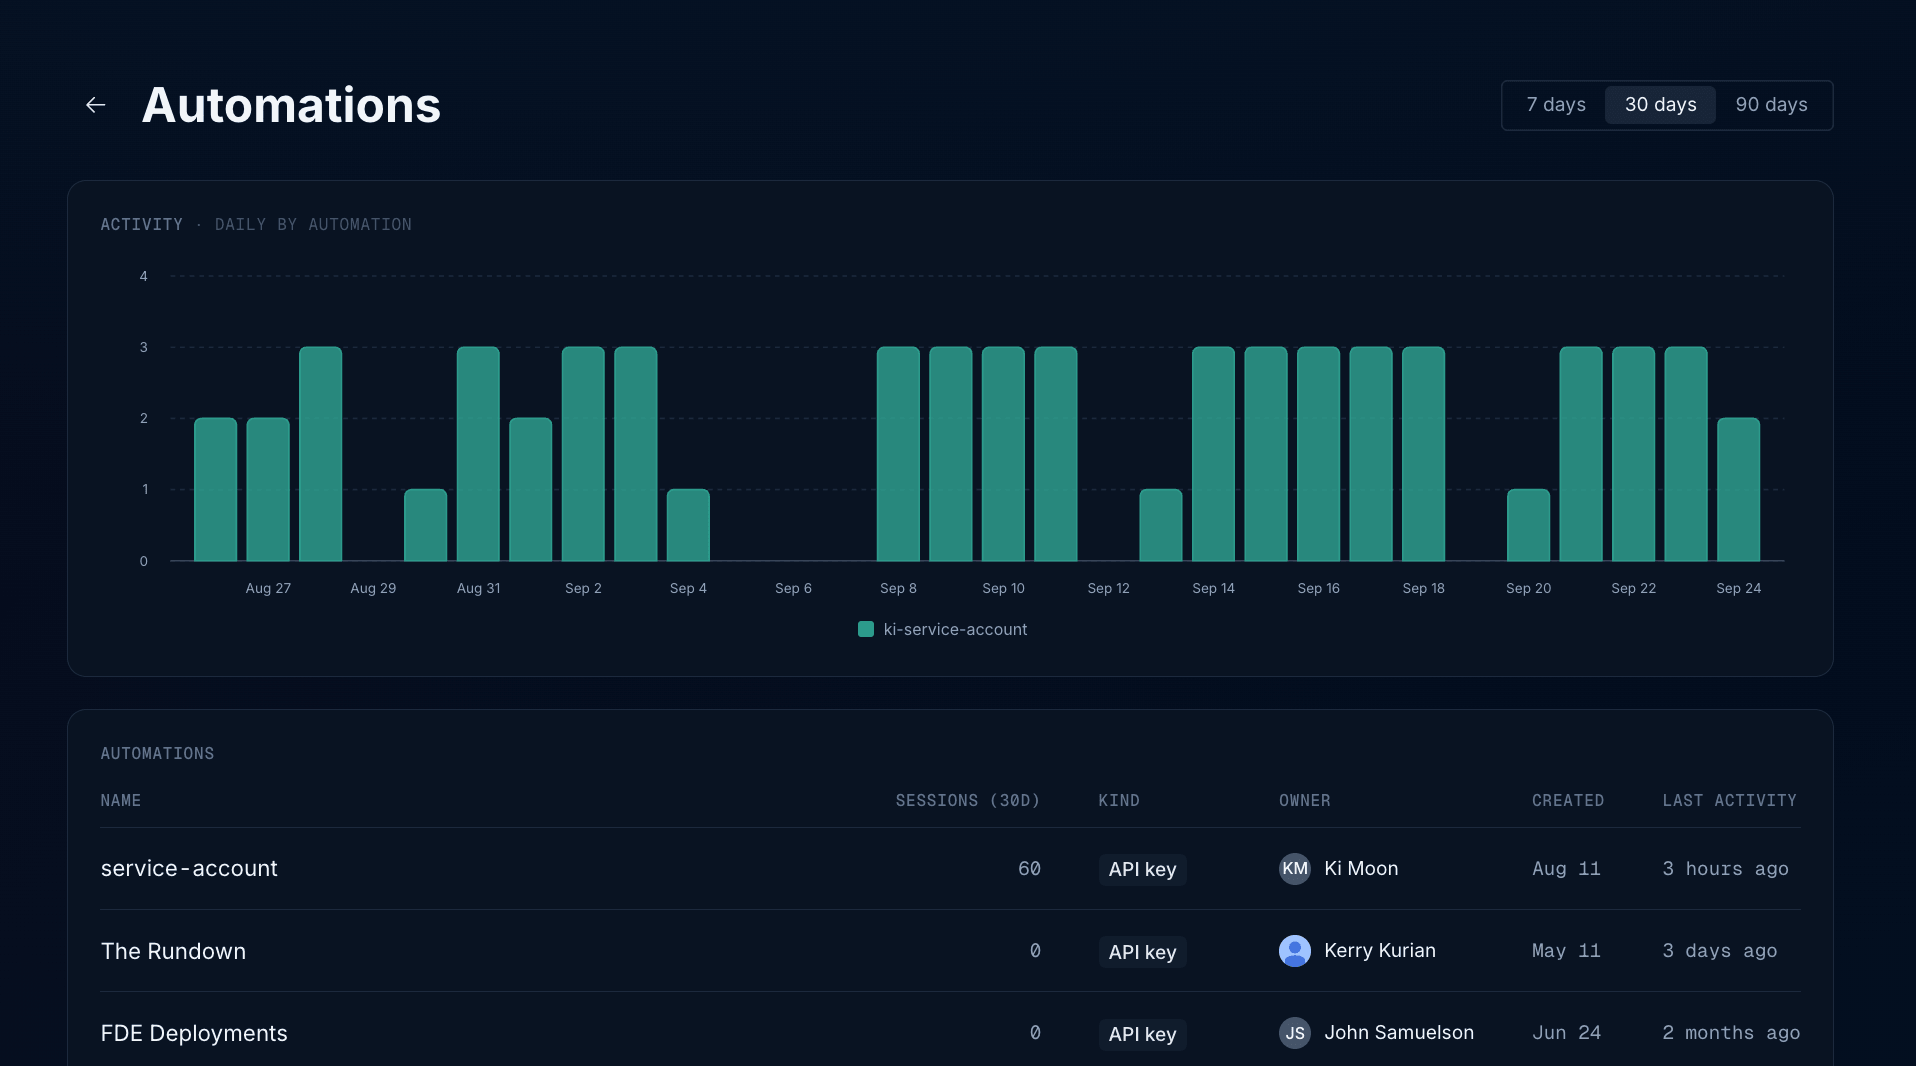
Automations view in the Console